
The cryptocurrency XRP is on an upward trend and is currently trading at $2.60, after a 7.3% increase in the last 24 hours.
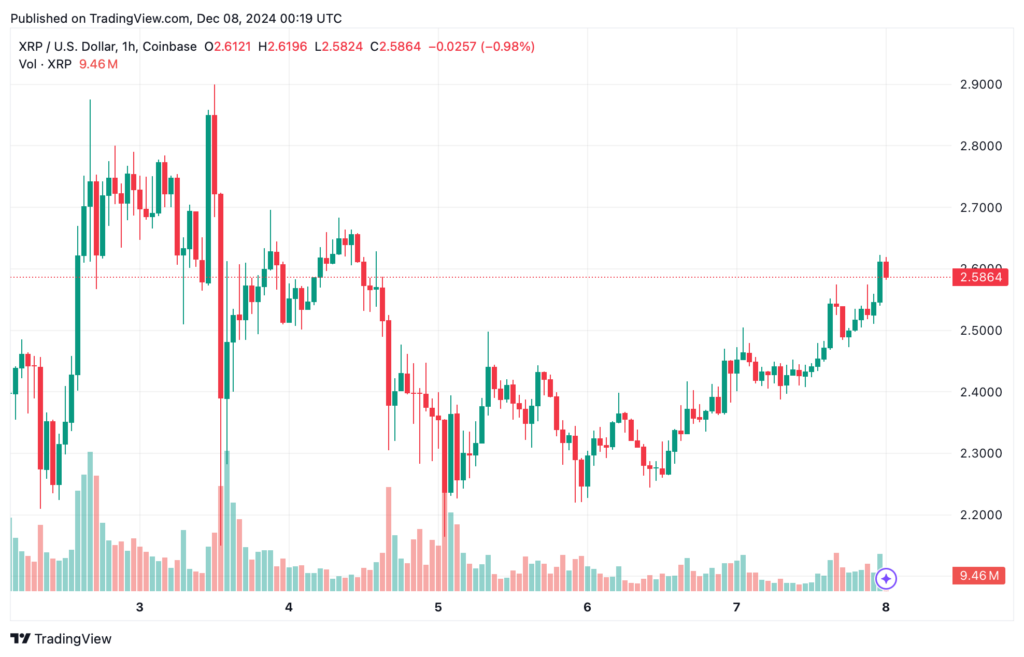
On the 1-hour chart, XRP is currently consolidating within a narrow range between $2.55 and $2.65, indicating reduced volatility. The Relative Strength Index (RSI) stands at 75.74, indicating ‘overbought’ conditions. The Moving Average Convergence Divergence (MACD) shows a positive signal with a value of 0.43886, but the low volume during this consolidation points to a cautious market sentiment.
A breakout above $2.65 could trigger a bullish move towards $2.75 or higher, while a downward breakout could test the support around $2.45.

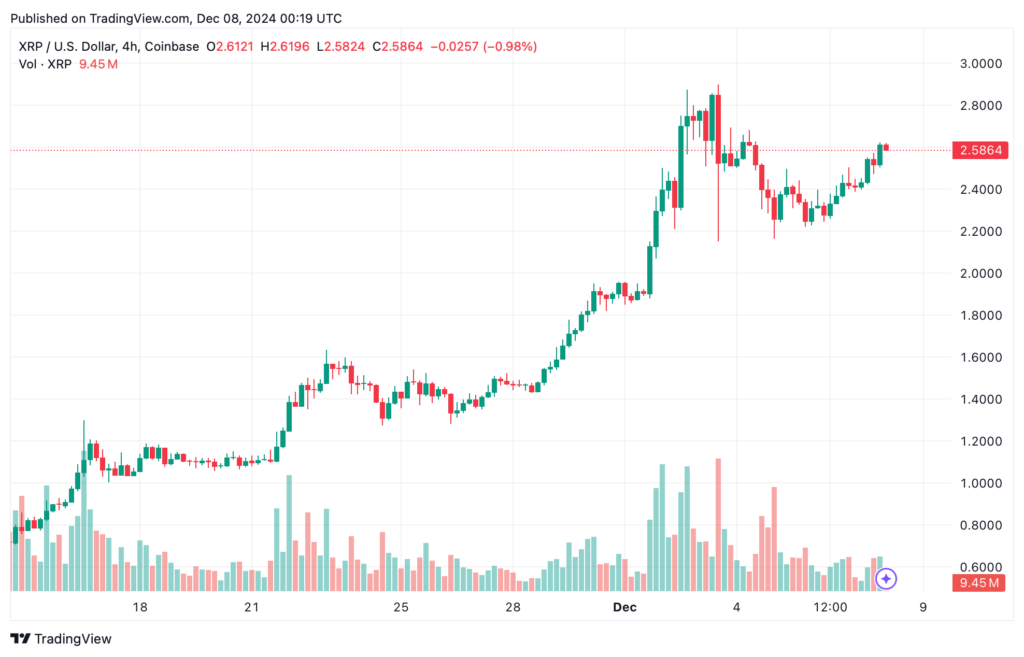
The 4-hour chart shows a recovery from a recent peak of $2.91 to a low of $2.10, followed by a gradual recovery with higher lows. Oscillators such as the Awesome Oscillator (AO) and the Stochastic show neutral signals with values of 1.08467 and 77.99, respectively, indicating a balanced market. Buyers appear to be accumulating at support levels between $2.30 and $2.50.
A breakthrough above $2.75 could spark optimism, while failure to hold the $2.30 support could trigger further declines towards $2.10.

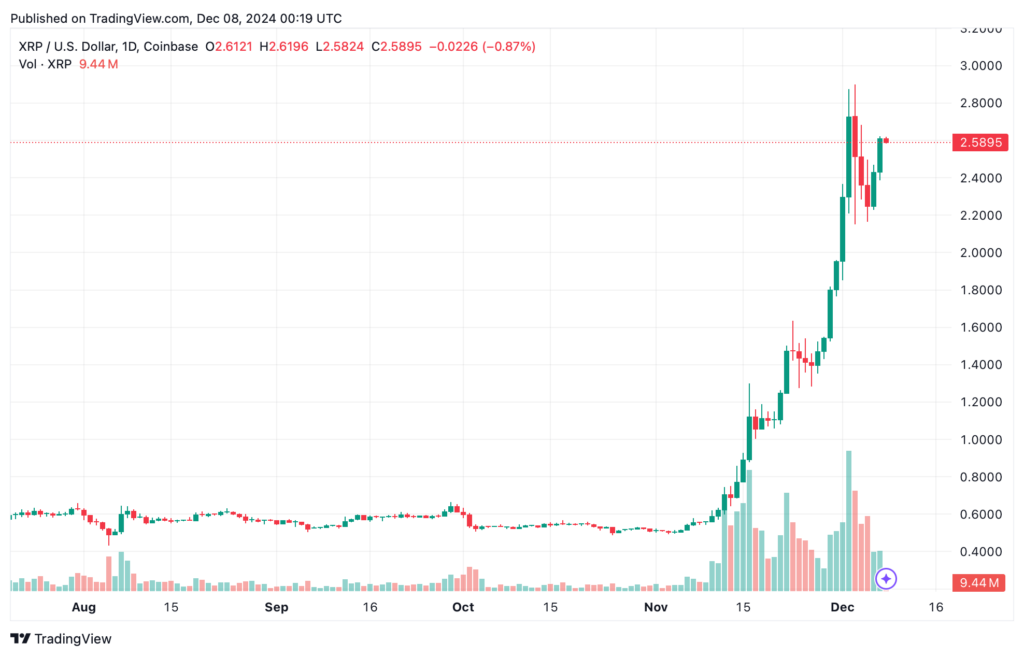
The daily chart of XRP shows a strong upward trend, with the coin rising from $0.50 to a recent peak of $2.91. However, declining trading volume suggests a possible weakening of momentum, which is confirmed by a rejection at resistance around $2.90. Long-term averages such as the Exponential Moving Average (EMA) and the Simple Moving Average (SMA) for 200 periods show strong buy signals at $0.81202 and $0.68557, respectively.
Current support lies between $2.20 and $2.40, which is crucial for a bullish continuation.

Oscillators show a divided sentiment: the RSI points to ‘overbought’ conditions, while the MACD shows bullish potential. The Commodity Channel Index (CCI) at 103.05 and the Momentum Oscillator at 1.05233 suggest that selling pressure may persist. However, all moving averages – from the short-term EMA (10) at $2.29829 to the long-term EMA (200) at $0.81202 – give a strong positive signal, reinforcing a positive bias for the medium and long term.
If XRP manages to break above $2.65 in the short term and this momentum carries through to $2.75 on the 4-hour chart, it could retest the $2.90 resistance or even surge above $3.00. The overwhelming buy signals from moving averages and the consistent higher lows on multiple timeframes point to strong bullish potential in the medium to long term.
If XRP fails to hold the critical support of $2.30 or breaks out of its consolidation range, selling pressure may increase. Indicators such as the ‘overbought’ RSI and selling pressure from momentum oscillators point to the possibility of a fallback to $2.10 or even $1.90, especially if the broader market sentiment weakens.